Embedded Analytics
A guide to embedded analytics, the integration of analytical capabilities, dashboards, and data visualizations directly into user-facing operational applications, bridging the gap between data exploration and operational workflows.
Data Where the Work Happens
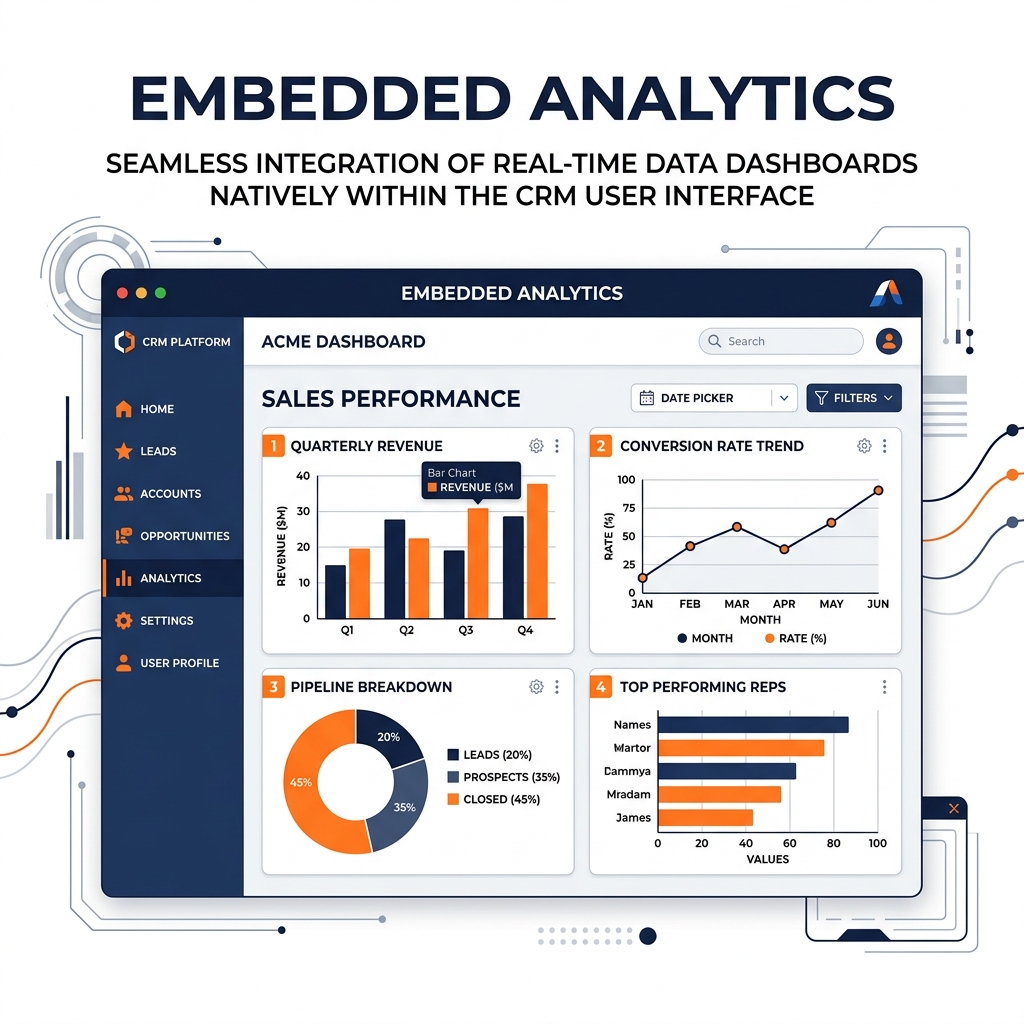
Historically, analytics required context-switching. If a sales representative using a CRM application wanted to see the historical purchasing trends of a client, they had to leave the CRM, open a separate Business Intelligence (BI) tool like Tableau or Power BI in a different browser tab, search for the client’s dashboard, analyze the data, and then switch back to the CRM to make a decision. This friction reduces data adoption; when users are forced to leave their workflow to find data, they often choose to make decisions without it.
Embedded analytics eliminates this context-switching by integrating analytical charts, dashboards, and interactive data explorations directly into the operational applications where users already spend their time. The data is embedded seamlessly into the application’s UI, appearing as a native feature of the software.
When a doctor opens a patient’s electronic health record, embedded analytics displays an interactive timeline of the patient’s vitals natively within the record view. When a vendor logs into an e-commerce platform’s seller portal, they see an embedded dashboard showing their daily sales velocity and inventory forecasts.
Levels of Embedded Analytics
Embedded analytics can be implemented at varying levels of complexity and integration:
1. Iframing (The Basic Level): The simplest approach. A dashboard built in a traditional BI tool is hosted on a server, and the application simply loads that URL within an HTML <iframe>. While easy to implement, this often looks disjointed, as the BI tool’s styling may clash with the host application, and interaction between the dashboard and the application UI is limited.
2. Component Embedding: Modern BI platforms provide JavaScript libraries or SDKs (Software Development Kits) that allow developers to embed specific charts or dashboard components natively into their application framework (React, Vue, Angular). This allows for deep integration: clicking a bar chart in the embedded analytics component can trigger an action in the host application’s UI.
3. Custom API-Driven Analytics (Headless): The most advanced level. The application uses a Headless BI layer (a Metric Store) to query the data via API and uses modern frontend charting libraries (D3.js, Chart.js, Recharts) to render the visualizations completely from scratch. This provides total control over the user experience and pixel-perfect brand alignment.
Architectural Requirements
Embedded analytics demands a highly scalable and performant underlying data architecture. A traditional BI dashboard used by 50 internal analysts has very different performance requirements than an embedded dashboard exposed to 50,000 external customers using a SaaS platform.
When embedding analytics in a customer-facing product, the underlying data platform (like an Iceberg lakehouse) must handle high-concurrency, low-latency API requests. Technologies like Dremio, which utilize Data Reflections to accelerate queries to sub-second response times, are critical. If the embedded dashboard takes 10 seconds to load while the rest of the application loads instantly, the user experience is ruined, and the analytics feature will be abandoned. Furthermore, strict multi-tenant Row-Level Security (RLS) must be enforced at the semantic layer to ensure a user only sees their own data within the embedded view.
Learn More
To dive deeper into these architectures and master the modern data ecosystem, check out the comprehensive books by Alex Merced available in our Books section.