Fact Tables
Fact tables in dimensional modeling are the central tables in a star schema that store quantitative measurements and metrics for business processes, forming the foundation of analytical reporting.
By Alex Merced Last updated
The Measurements of the Business
In dimensional modeling (the design methodology created by Ralph Kimball), data is categorized into two fundamental types: facts and dimensions. A fact table is the central table in a star schema, and it records the measurements, metrics, or facts of a specific business process.
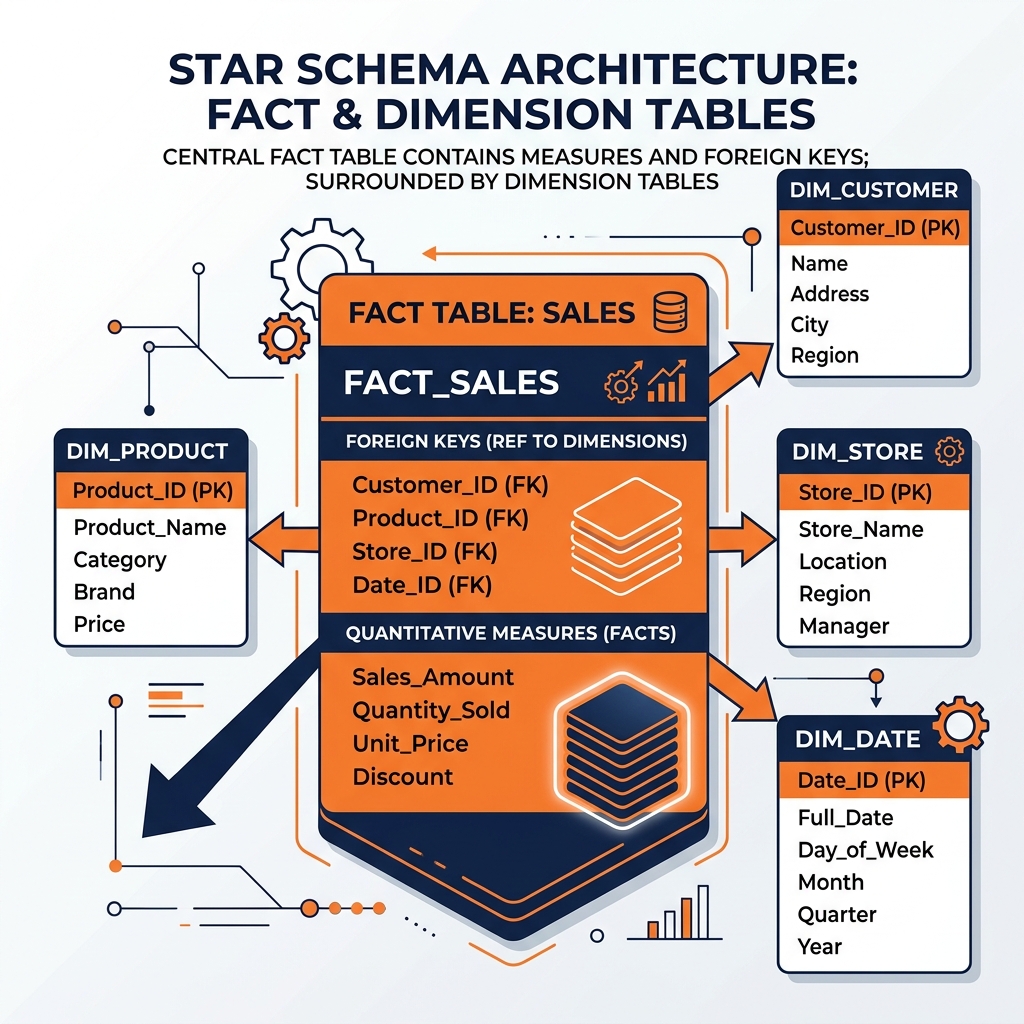
If a business process is “a customer purchases a product,” the fact table (fact_sales) records the quantifiable metrics of that event: how many units were sold, what the total revenue was, and what the discount amount was.
Fact tables are characteristically deep (containing millions or billions of rows) but narrow (containing relatively few columns). They are optimized for rapid aggregation (SUM, AVG, COUNT) across massive datasets. A typical analytical query groups data by attributes in dimension tables and calculates sums or averages over the numeric columns in the fact table.
Anatomy of a Fact Table
A well-designed fact table consists of two primary types of columns:
1. Foreign Keys: These are the integer keys that link the fact table to its surrounding dimension tables. A fact_sales table will contain date_key, customer_key, product_key, and store_key. These keys establish the context for the measurement.
2. Measures: These are the numeric values that represent the business event. Measures are typically additive, meaning they can be meaningfully summed across all dimensions. Examples include sales_amount, quantity_sold, and tax_amount. If you sum sales_amount across the date_key, you get total sales over time; if you sum it across the store_key, you get total sales by location.
Types of Fact Tables
Transactional Fact Tables: The most common type. A row is inserted only when a business event occurs (e.g., a single scan at a checkout register). The granularity is the individual transaction. These tables can grow to billions of rows very quickly.
Periodic Snapshot Fact Tables: A row summarizes a business process over a standard period (e.g., daily or monthly). Instead of recording every individual transaction, a periodic snapshot table might record the closing_account_balance for every customer at the end of every day. This is useful for analyzing trends over time where individual transactions are less important than the cumulative state.
Accumulating Snapshot Fact Tables: A single row tracks the entire lifecycle of a process that has defined beginning and end states. An order_fulfillment_fact table might have one row per order, with multiple date foreign keys (order_placed_date_key, shipped_date_key, delivered_date_key) that are updated as the order moves through the pipeline. This is ideal for measuring pipeline efficiency and lag times between stages.
Fact Tables in the Lakehouse
In an Iceberg lakehouse, fact tables are stored in the Gold layer of the Medallion architecture. Because fact tables are massive, they require careful physical optimization:
Partitioning: Fact tables are almost always partitioned by time (e.g., day(transaction_date) or month(transaction_date)) so that queries analyzing specific timeframes can prune irrelevant historical data.
Z-Ordering / Sorting: To accelerate queries filtering by customer or product, fact tables are often Z-ordered or sorted by high-cardinality foreign keys (customer_key, product_key) to maximize file-level data skipping.
Learn More
For a longer treatment of this and the architecture around it, see the books by Alex Merced. You can also browse the rest of the knowledge base.