Data Observability
Data observability is the practice of continuously monitoring data pipelines and data assets for reliability, freshness, quality, and anomalies to ensure the trustworthiness of analytical outputs.
By Alex Merced Last updated
Beyond Testing: Continuous Data Health Monitoring
Data quality testing (dbt tests, Great Expectations checks) validates that specific, known rules hold at pipeline execution time. If an engineer knows that the customer_id column should be non-null and unique, they can write a test for it. But data systems fail in ways that no test anticipated. The third-party data vendor that gradually started delivering 20% fewer records per day. The upstream database that changed a column’s data type in a breaking way without notification. The pipeline that runs successfully but produces statistically different distributions from the historical baseline due to a subtle logic bug.
Data observability addresses the class of data issues that declarative tests cannot catch: unexpected behavioral changes, statistical drift, freshness degradation, and volume anomalies that are only detectable through continuous monitoring of historical patterns rather than point-in-time rule evaluation.
The term “data observability” is deliberately borrowed from software systems observability (metrics, logging, tracing). Just as DevOps teams monitor system health metrics continuously to detect anomalies before they become user-visible outages, data observability monitors data pipeline health metrics continuously to detect data quality degradation before it produces wrong reports.
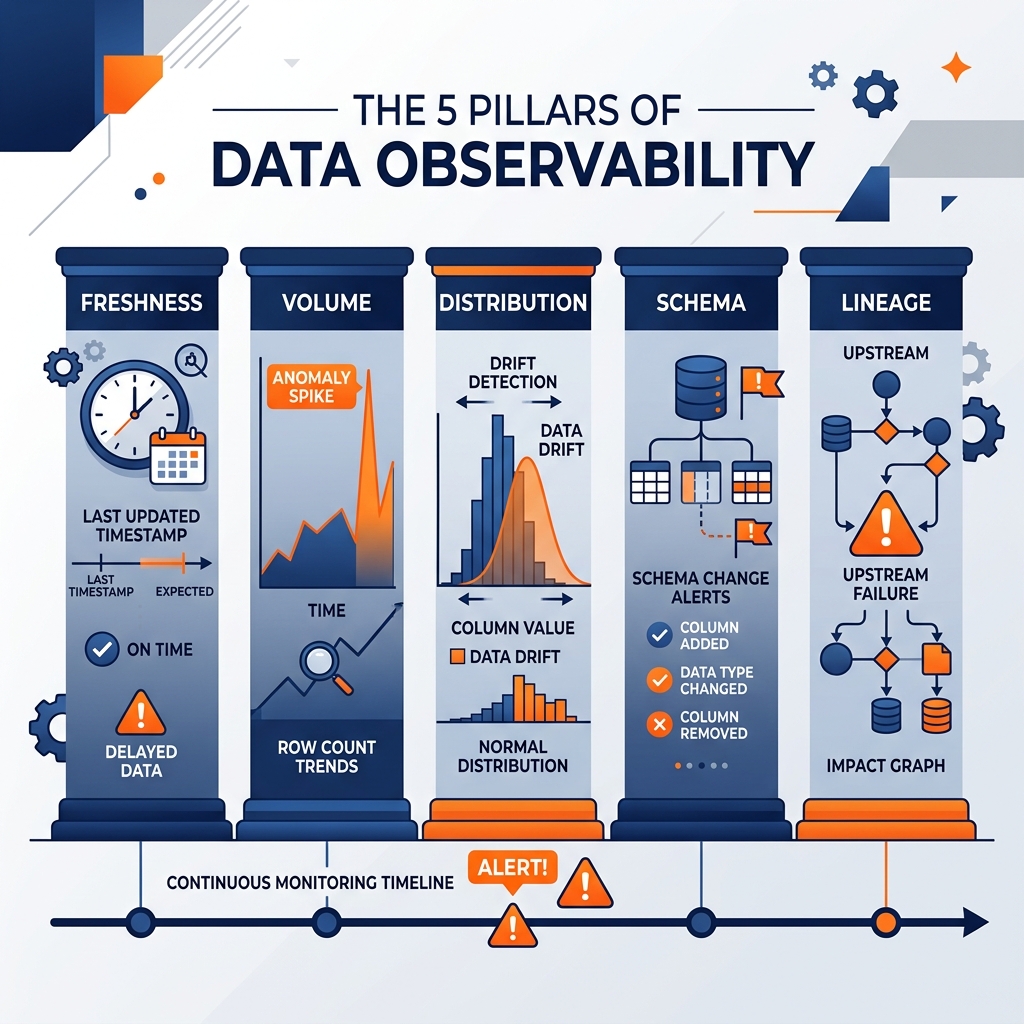
The Five Pillars of Data Observability
The data observability framework described by industry leaders like Monte Carlo organizes observable data health into five dimensions.
Freshness: Is the data being updated as frequently as expected? A dashboard that claims to show “today’s sales” but is actually showing yesterday’s data because the pipeline failed silently is a freshness violation. Freshness monitoring tracks the expected and actual update frequency of each table and alerts when the gap between the current time and the last update exceeds a configured threshold.
Volume: Is the row count of each table changing at an expected rate? A table that normally grows by 50,000 rows per daily pipeline run and suddenly grows by 200,000 rows (double-counting bug) or 5,000 rows (partial extraction failure) has a volume anomaly. Volume monitoring learns the baseline growth rate distribution from historical runs and alerts on statistical outliers.
Distribution: Are the value distributions of each column consistent with historical patterns? A currency amount column that historically has 95% of values between $10 and $10,000 but suddenly has 30% of values below $0 (sign reversal in a currency conversion) has a distribution anomaly that no declarative test would catch unless someone anticipated and explicitly tested for negative amounts.
Schema: Has the schema of a table changed unexpectedly? New columns, dropped columns, or type changes that weren’t coordinated with downstream consumers break pipelines. Schema monitoring tracks schema changes and alerts when they occur.
Lineage: When an anomaly is detected in a downstream table, which upstream tables and pipelines are the most likely root causes? Lineage monitoring integrates with automated impact analysis to accelerate root cause identification.
Data Observability Platforms
Monte Carlo is the most widely adopted commercial data observability platform, integrating with data warehouses, lakehouses, and orchestration tools to provide automatic baseline learning and anomaly detection across all five observability dimensions. Acceldata, Bigeye, and Lightup offer similar capabilities.
The open-source OpenTelemetry and OpenLineage standards are being adopted as the plumbing for data observability infrastructure, enabling observability data (freshness metrics, row counts, schema versions, lineage events) to be emitted by any pipeline tool and consumed by any observability platform through standardized interfaces.
Observability in the Iceberg Lakehouse
Apache Iceberg’s metadata layer provides rich signals for data observability. Each Iceberg snapshot records the commit timestamp, the number of files added and removed, and the total record count delta. Monitoring tools can poll the Iceberg metadata layer for new snapshots and extract these signals automatically without query overhead. If no new snapshot has been committed within the freshness threshold, or if the row count delta is outside the expected volume range, the monitoring system generates an alert.
Dremio’s job history and catalog metadata provide additional observability signals: query execution patterns (which tables are being queried frequently, which queries are taking unusually long), reflection status (when was the last successful reflection refresh, are reflections stale), and Virtual Dataset dependency graphs. These signals complement Iceberg’s metadata-level signals to provide comprehensive data platform health monitoring.
Learn More
For a longer treatment of this and the architecture around it, see the books by Alex Merced. You can also browse the rest of the knowledge base.