Data Quality
Data quality in the modern data lakehouse covers the principles, dimensions, patterns, and tools that ensure analytical data is accurate, complete, consistent, and trustworthy.
By Alex Merced Last updated
The Cost of Bad Data
Every organization running an analytics platform eventually confronts data quality failures, and the consequences range from embarrassing to catastrophic. An executive presents the wrong revenue figures to the board of directors because a pipeline bug double-counted transactions. A machine learning model produces systematically biased recommendations because its training data had systematic null values in a critical demographic column. A regulatory filing contains inaccurate figures because a currency conversion applied the wrong exchange rate to six months of transactions.
The TDWI (Data Warehousing Institute) has estimated the cost of poor data quality to U.S. businesses at over $600 billion annually. This figure, while imprecise, reflects a real phenomenon: decisions made on wrong data are systematically worse than decisions made on correct data, and the cost of the wrong decisions dwarfs the cost of the data quality infrastructure that would have prevented them.
Data quality is not a single attribute but a multidimensional concept. The IBM data quality framework defines six primary dimensions: completeness (does the data contain all the information it should?), accuracy (does the data correctly reflect the real-world entity it describes?), consistency (is the same information represented identically across different systems?), timeliness (is the data available when needed?), uniqueness (does the data contain duplicate records?), and validity (does the data conform to defined business rules and format constraints?). Effective data quality management requires monitoring and controlling all six dimensions simultaneously.
Data Quality in the Pipeline: Shift Left
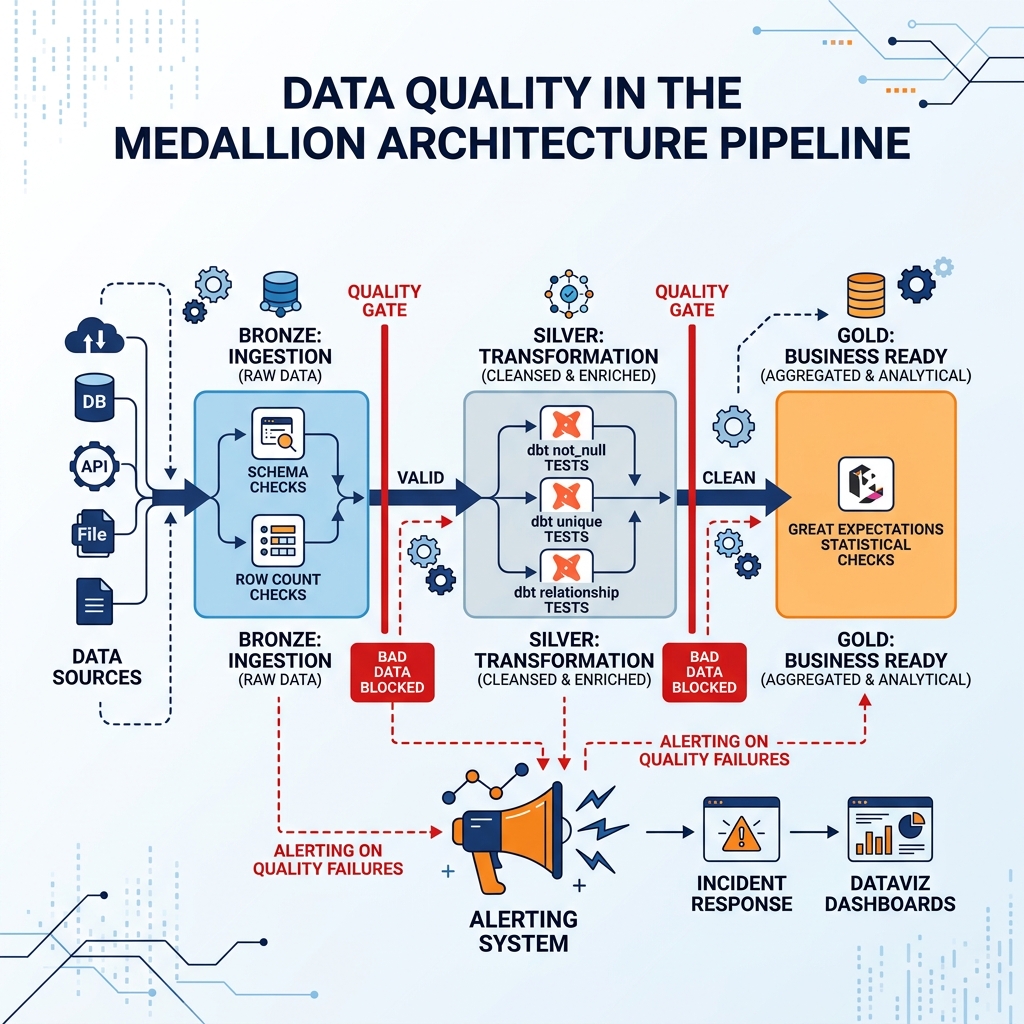
The most effective data quality strategy applies checks as early in the pipeline as possible, a principle called “shifting left.” Detecting a data quality issue at the Bronze layer (immediately after ingestion from the source system) is far cheaper and faster to remediate than detecting it at the Gold layer (after weeks of transformations have propagated the error through dozens of downstream tables and dashboards).
Shifting left means instrumenting the ingestion layer with quality checks that run immediately when raw data lands. Basic completeness checks verify that required columns are not null. Freshness checks verify that data from each source system arrived within the expected time window. Row count checks verify that the volume of ingested data is consistent with historical patterns. Schema checks verify that the source system has not changed its column structure in a breaking way.
dbt’s testing framework implements these checks as part of the transformation pipeline. dbt tests are defined in YAML configuration files alongside the transformation models, running automatically after each model is built. A not_null test on the customer_id column of the Silver layer customer table verifies that no customer record is missing its identifier. A unique test verifies that no customer ID appears more than once. A relationships test verifies that every customer_id in the Orders table matches a valid record in the Customer table. dbt reports test results as part of the pipeline run, blocking advancement to the Gold layer when critical tests fail.
Great Expectations is a more comprehensive Python-based data quality framework that supports the full spectrum of data quality checks, from basic null and uniqueness checks to complex statistical distribution validations. Great Expectations generates a “Data Docs” portal that displays the results of every quality check run in a human-readable HTML format, making data quality status visible to the entire data team without requiring SQL expertise.
Data Quality Monitoring and Alerting
Declarative data quality tests catch known quality rules at pipeline run time. But data quality issues also arise in more subtle forms that are not easily expressed as declarative rules: gradual drift in column distributions, unexpected changes in row-level business logic results, or subtle correlation shifts between columns. These issues require statistical anomaly detection rather than declarative rule checking.
Data observability platforms like Monte Carlo, Acceldata, and Lightup monitor data assets continuously, learning baseline statistical profiles (typical row counts, typical column value distributions, typical null rates) from historical data and alerting when current pipeline outputs deviate significantly from these baselines. This statistical monitoring catches the classes of data quality issues that declarative tests miss: the third-party data vendor that gradually started delivering fewer records per day without changing their schema, or the ETL bug that causes one regional market’s data to be systematically underrepresented.
Dremio’s catalog metadata and job history provide the raw data that supports data observability workflows. Query patterns and table usage metrics visible through Dremio’s REST API allow organizations to build custom freshness and quality dashboards that track data platform health from the analytical access layer perspective.
Learn More
For a longer treatment of this and the architecture around it, see the books by Alex Merced. You can also browse the rest of the knowledge base.