Data Lineage
Data lineage is the map of a data asset's lifecycle that traces its origins, transformations, and downstream consumption to ensure trust, simplify debugging, and enable impact analysis.
By Alex Merced Last updated
Following the Data Trail
When a CEO points to a dashboard and asks, “Why is the Q3 revenue number lower than what Finance reported?”, the data team must be able to answer the question quickly and definitively. If the team cannot explain exactly how that specific number was calculated and where the underlying data came from, the executive’s trust in the data platform evaporates.
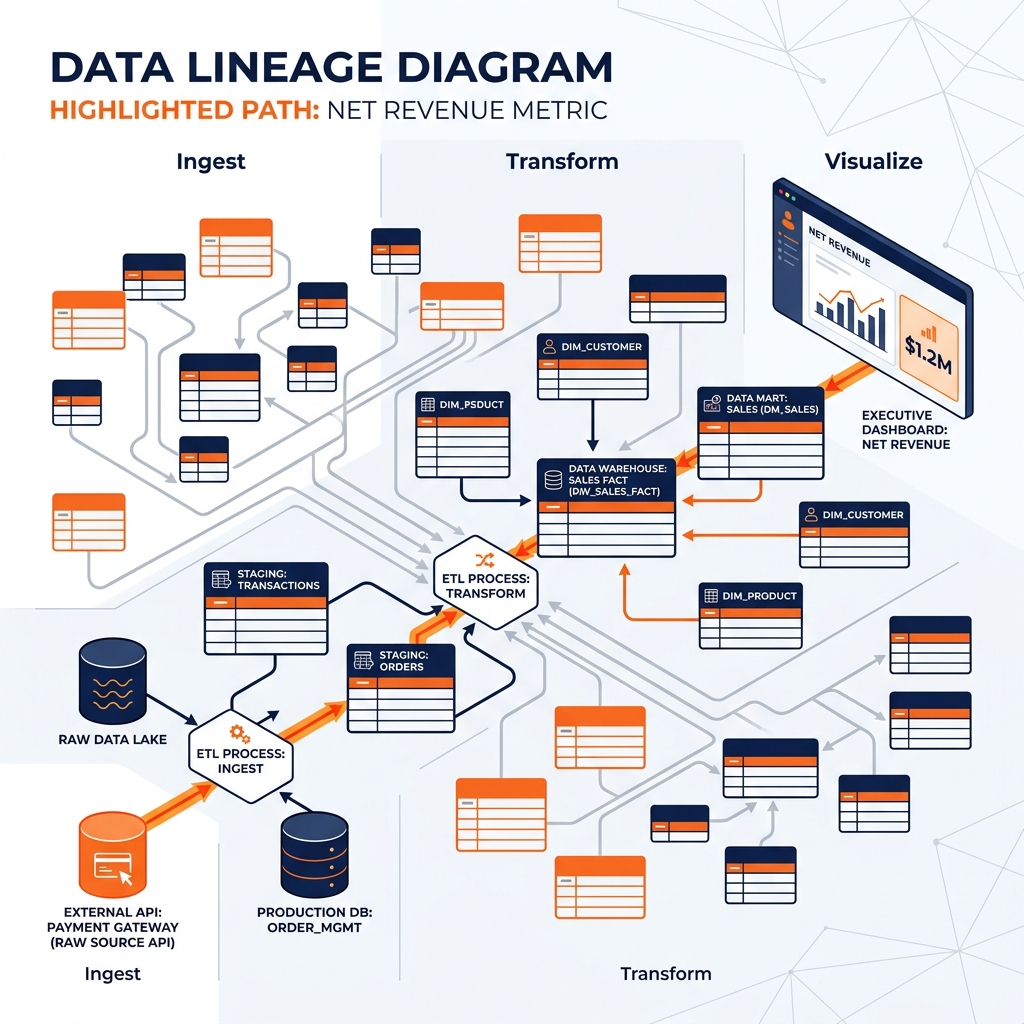
Data lineage is the map that provides this answer. It is the comprehensive record of a data asset’s lifecycle, tracing it from its origin in a source system, through every transformation and aggregation in the data pipeline, to its final consumption point in a dashboard or machine learning model.
Think of data lineage as a supply chain map for information. Just as a food manufacturer must be able to trace a contaminated batch of cookies back to the specific farm that supplied the bad flour, a data engineer must be able to trace a corrupted dashboard metric back to the specific upstream table or API that introduced the bad data.
Types of Data Lineage
Table-Level Lineage: The highest level of abstraction. It shows that fact_sales is built by joining stg_orders and stg_payments. It provides a macroscopic view of dependencies but lacks precision.
Column-Level Lineage: The granular, operational level. It traces the exact path of a specific field. It shows that the net_revenue column in the final dashboard is derived specifically from the gross_amount column in stg_orders minus the refund_amount column in stg_payments.
Execution (Runtime) Lineage: Traces not just the structural relationships, but the actual execution runs. It shows that fact_sales was last updated at 2:00 AM by Airflow DAG run #4502 using version 1.4 of the dbt model code.
Use Cases for Data Lineage
Impact Analysis: Before a data engineer drops a column from an upstream Silver table, they consult the lineage graph. The graph reveals that this specific column is used downstream by an executive dashboard and two machine learning models. The engineer can now proactively notify the owners of those downstream assets before making the breaking change.
Root Cause Analysis: When a data quality alert fires on a Gold table, the engineer follows the lineage upstream. If the user_age column suddenly contains negative numbers, lineage allows the engineer to trace the column back through the dbt transformations to discover that the root cause was an API change in the source CRM system.
Regulatory Compliance: Auditors for GDPR, CCPA, or financial regulations often require proof of how specific sensitive metrics are calculated and who has accessed them. Automated data lineage provides the immutable audit trail required to prove compliance.
Automating Lineage in the Modern Stack
Historically, data lineage was maintained manually in Excel spreadsheets or Confluence wikis, which meant it was instantly out of date.
In the modern data stack, lineage is generated automatically by parsing the code that transforms the data. Tools like dbt automatically generate a Directed Acyclic Graph (DAG) and lineage map based on the SQL ref() functions. Advanced data catalogs (like Alation or Datahub) parse the query logs from engines like Dremio or Snowflake to reverse-engineer column-level lineage automatically, ensuring the map is always an accurate reflection of the running code.
Learn More
Several of the books by Alex Merced cover this in depth, and a few of them are free. The rest of the knowledge base is worth a look too.