Rollup Tables
A guide to rollup tables, the pre-aggregated summary tables used to accelerate analytical queries by storing high-level metrics instead of forcing the database to scan millions of raw transaction rows.
Pre-Computing the Answers
If a retail CEO opens a dashboard to view “Total Sales by Region for 2025,” the underlying query is logically simple: SELECT region, SUM(sales) FROM transactions WHERE year = 2025 GROUP BY region.
However, physically executing that query might require the database engine to scan 500 million individual transaction rows, extract the sales amount, and sum them up. Even with modern columnar formats and fast compute clusters, this operation might take several seconds. If 100 regional managers open that dashboard simultaneously, the database cluster will saturate, and performance will collapse.
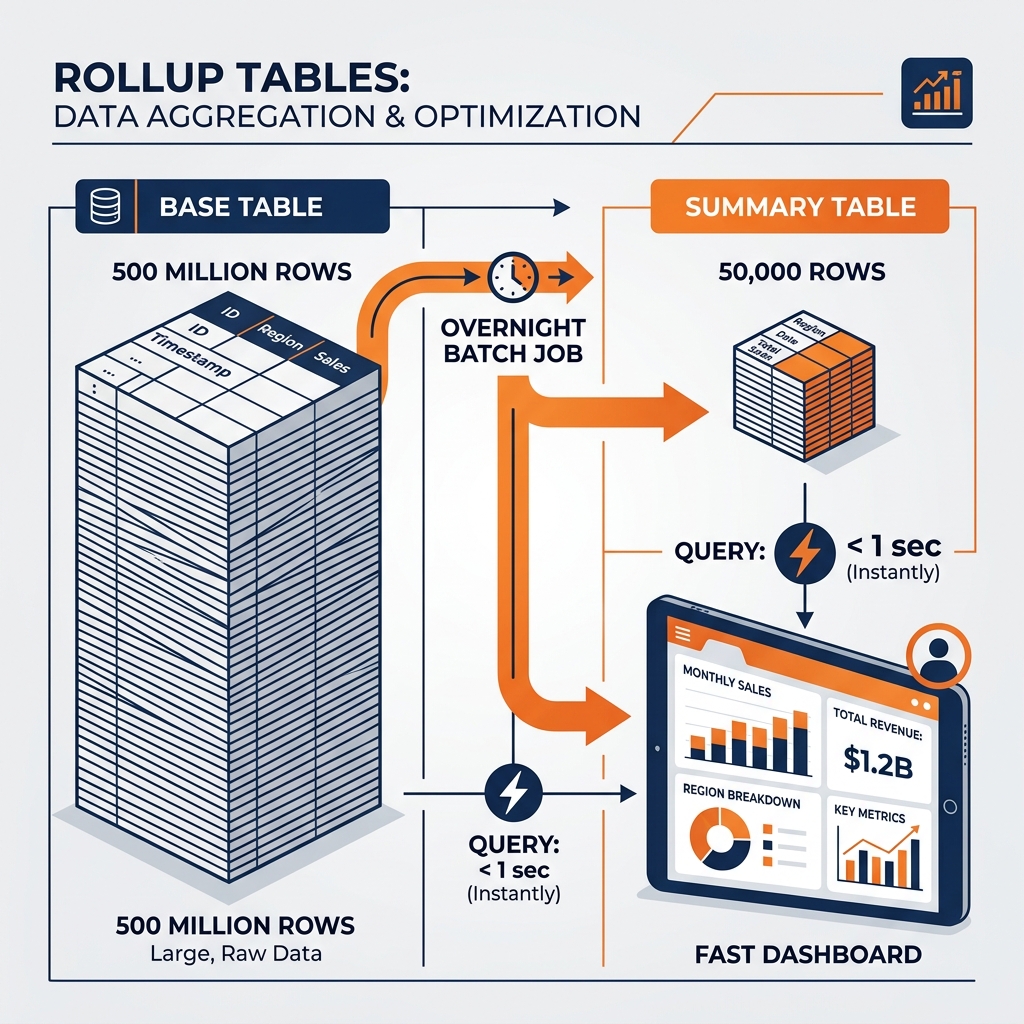
A rollup table (also known as an aggregate table or summary table) solves this problem by shifting the computational burden from “read time” to “write time.” Instead of waiting for the user to ask the question, data engineers proactively run the heavy aggregation query in a nightly batch job and store the results in a new, tiny table.
The Architecture of Rollups
The Base Table: The massive, granular fact_transactions table containing 500 million rows (one for every item scanned at a cash register).
The Rollup Table: A new table, perhaps called agg_sales_daily_by_region. The nightly ETL pipeline runs a GROUP BY date, region query against the base table and inserts the results here. This table might only contain 50,000 rows.
When the CEO opens the dashboard, the BI tool does not query the 500 million row base table. It queries the 50,000 row rollup table. The database returns the answer in milliseconds, consuming almost zero compute resources.
Managing Rollup Complexity
While rollup tables provide massive performance gains, they introduce significant management complexity for data teams:
Pipeline Sprawl: If the business wants to analyze data by Region, you need a Region rollup. If they want to analyze by Product Category, you need a Category rollup. Soon, the data team is managing 50 different ETL pipelines just to build various rollup permutations.
Query Routing (The “Dashboard Trap”): If a BI analyst builds a dashboard pointing explicitly to the agg_sales_daily_by_region table, that dashboard breaks if they try to drill down to the specific store level, because the store-level data doesn’t exist in the region rollup table. They have to build a separate dashboard pointing to the base table.
The Modern Solution: Transparent Materialization
Modern lakehouse engines like Dremio eliminate the manual management of rollup tables through features like Data Reflections.
A data engineer still defines the aggregation (the rollup logic), but Dremio stores it as a hidden physical file (a Reflection) rather than a separate table. The BI analyst always queries the massive fact_transactions base table. When the query arrives, Dremio’s query planner automatically realizes, “I can answer this query using the hidden Reflection instead of scanning the base table,” and transparently rewrites the query under the hood.
This gives the performance of rollup tables without forcing analysts to understand which specific summary table to query.
Learn More
To dive deeper into these architectures and master the modern data ecosystem, check out the comprehensive books by Alex Merced available in our Books section.